Riedheim (basaltic dyke)
This data set was acquired because of the expected 2D subsurface structure and can maybe serve as a data set to test a 2D inversion. The data set was recorded and investigated by Zacharias Stelzer during his diploma thesis (Stelzer, Z., Acquisition and interpretation of surface waves for waveform inversion (written in german), diploma thesis in preparation, Karlsruhe).
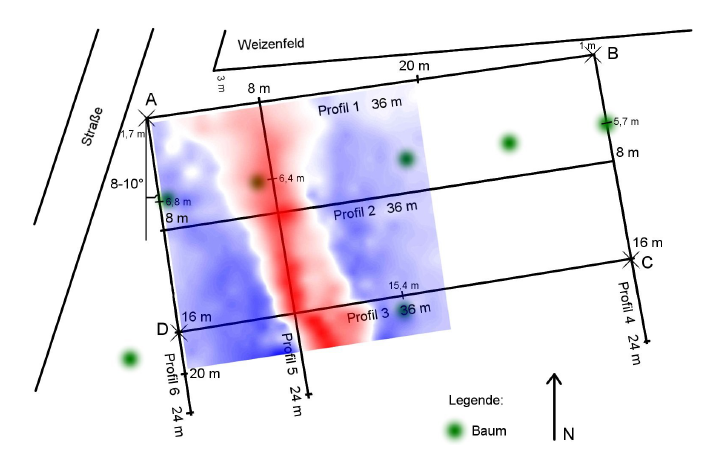
At this site a basaltic dyke is crossing a meadow with some fruit trees approximately from north to south. The vertical seismic wavefield was recorded along six profiles parallel and perpendicular to the basaltic dyke. Furthermore the vertical gradient of the magnetic field was measured. In the figure below (see "Map of profiles") you can see the result of the magnetic measurement (the red anomaly is caused by the basaltic dyke) overlaid with a sketch showing the position of the seismic profiles.
72 vertical geophones (4.5 Hz) recorded the wavefield along the profiles 1-3 (perpendicular to the basaltic dyke) and 48 vertical geophones (4.5 Hz) recorded the wavefield along the profiles 4-6 (parallel to the anomaly). A hammer blow was used as source. Beside forward and reverse shots also distant shots, shots in the middle of the profiles and shots outside of the profiles were used to record several data sets.
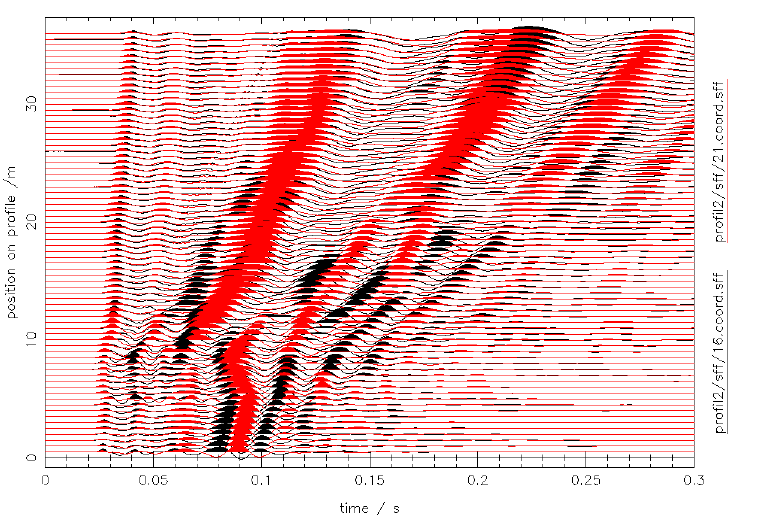
A standard refraction analysis of the profiles 4 and 6 parallel to the basaltic dyke suggests a two layer over a halfspace "background" subsurface structure with slightly tilted interfaces. Therefore the structure is not perfectly 2D but it can be approximated by a 2D subsurface model. This is also supported by the comparison of the wavefields recorded at profile 2 with a shot at point A (black seismograms) and a shot at point D (red seismograms) shown below.
To obtain this data set or if you have further questions please contact Thomas Forbriger or contact Lisa Rehor.
Map of profiles:
Comparison of raw seismogram gathers:
In the following figure you can see the wavefields recorded at profile 2 with a shot at point A (black seismograms) and a shot at point D (red seismograms).